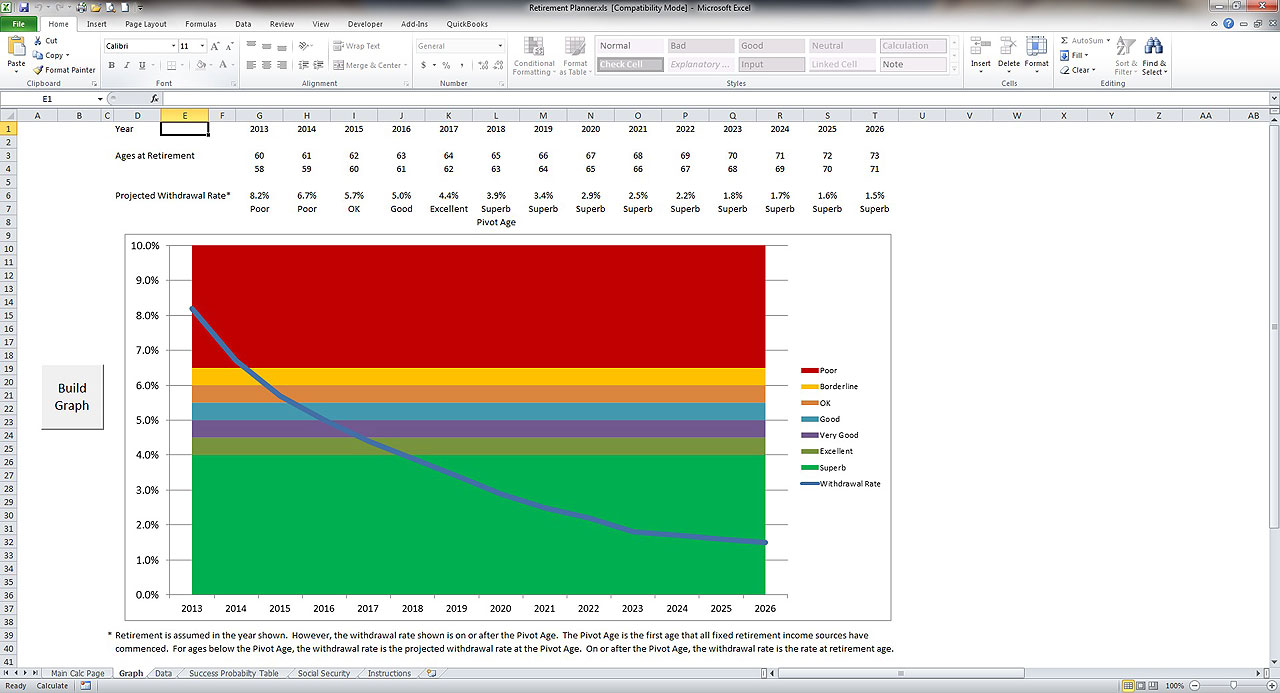
Withdrawal Rates
The Retirement Planner uses ranges of withdrawal rates organized into a Success Probability Table to gauge the probability that a retiree will not outlive their portfolio (i.e., success). The probability of success depends on a combination of factors, including life expectancy, asset allocation and withdrawal rate. This page provides withdrawal rates and their associated success probabilities for a wide range of retirement durations and asset allocations.
The success probabilities shown on this page were calculated based on the Morningstar Ibbotson capital market database from 1926 to 2013 using Monte Carlo simulations of 100,000 iterations for each initial withdrawal rate. The tables labeled “Traditional Safe Withdrawal Rates” assume that the first year withdrawal is the stated percentage and subsequent year withdrawals are increased annually by inflation. For a description of the dynamic withdrawal technique used to develop the tables labeled “Target Percentage Adjustment” and “Target Percentage with 3% Maximum Adjustment” see www.TargetPercentage.com.
“This is a great tool.” ~ Ted R., CFP
Click below for withdrawal rates and their associated the success probabilities based on the desired asset allocation:
Table A – 30% Stocks / 70% Bonds
Table B – 40% Stocks / 60% Bonds
Table C – 50% Stocks / 50% Bonds
Table D – 60% Stocks / 40% Bonds
Table E – 70% Stocks / 30% Bonds
ITGB = Intermediate-term Government Bonds
![]()
 |
 |
| Click on screenshots to enlarge | |
 |
 |
*The Retirement Planner is only $99.00 first year with
$49.00 annual renewals
| Table A 30% Stocks / 70% Bonds |
||||||
| 24% Large cap / 6% Small cap / 70% ITGB | ||||||
| Highest Initial Withdrawal Rate | ||||||
| Retirement | Traditional Safe Withdrawal Rates | |||||
| Duration | Probability of Success | |||||
| (Years) | 70% | 75% | 80% | 85% | 90% | 95% |
| 10 | 11.3% | 11.0% | 10.8% | 10.5% | 10.2% | 9.7% |
| 15 | 8.1% | 7.9% | 7.7% | 7.5% | 7.2% | 6.8% |
| 20 | 6.6% | 6.4% | 6.2% | 6.0% | 5.8% | 5.4% |
| 25 | 5.7% | 5.6% | 5.4% | 5.2% | 4.9% | 4.6% |
| 30 | 5.2% | 5.0% | 4.8% | 4.6% | 4.4% | 4.0% |
| 35 | 4.8% | 4.6% | 4.4% | 4.2% | 4.0% | 3.7% |
| 40 | 4.5% | 4.3% | 4.2% | 4.0% | 3.8% | 3.4% |
| Retirement | Target Percentage with 3% Maximum Adjustment | |||||
| Duration | Probability of Success | |||||
| (Years) | 70% | 75% | 80% | 85% | 90% | 95% |
| 10 | 12.3% | 12.0% | 11.8% | 11.5% | 11.2% | 10.7% |
| 15 | 9.2% | 9.0% | 8.8% | 8.6% | 8.2% | 7.8% |
| 20 | 7.7% | 7.5% | 7.3% | 7.1% | 6.8% | 6.4% |
| 25 | 6.9% | 6.7% | 6.5% | 6.3% | 6.0% | 5.6% |
| 30 | 6.3% | 6.1% | 5.9% | 5.7% | 5.5% | 5.1% |
| 35 | 5.9% | 5.7% | 5.6% | 5.4% | 5.1% | 4.8% |
| 40 | 5.6% | 5.4% | 5.2% | 5.0% | 4.8% | 4.5% |
| Retirement | Target Percentage Adjustment | |||||
| Duration | Probability of Success | |||||
| (Years) | 70% | 75% | 80% | 85% | 90% | 95% |
| 10 | 12.9% | 12.8% | 12.6% | 12.3% | 12.0% | 11.5% |
| 15 | 10.1% | 9.9% | 9.7% | 9.5% | 9.1% | 8.7% |
| 20 | 8.7% | 8.5% | 8.3% | 8.1% | 7.8% | 7.4% |
| 25 | 7.9% | 7.7% | 7.5% | 7.3% | 7.0% | 6.6% |
| 30 | 7.3% | 7.2% | 7.0% | 6.8% | 6.5% | 6.1% |
| 35 | 6.9% | 6.8% | 6.6% | 6.4% | 6.1% | 5.8% |
| 40 | 6.6% | 6.4% | 6.3% | 6.1% | 5.8% | 5.5% |
| Table B 40% Stocks / 60% Bonds |
||||||
| 32% Large cap / 8% Small cap / 60% ITGB | ||||||
| Highest Initial Withdrawal Rate | ||||||
| Retirement | Traditional Safe Withdrawal Rates | |||||
| Duration | Probability of Success | |||||
| (Years) | 70% | 75% | 80% | 85% | 90% | 95% |
| 10 | 11.4% | 11.1% | 10.9% | 10.5% | 10.1% | 9.5% |
| 15 | 8.3% | 8.1% | 7.8% | 7.6% | 7.2% | 6.7% |
| 20 | 6.8% | 6.6% | 6.4% | 6.1% | 5.8% | 5.3% |
| 25 | 6.0% | 5.8% | 5.5% | 5.3% | 5.0% | 4.6% |
| 30 | 5.4% | 5.2% | 5.0% | 4.8% | 4.5% | 4.1% |
| 35 | 5.0% | 4.8% | 4.6% | 4.4% | 4.1% | 3.7% |
| 40 | 4.8% | 4.6% | 4.4% | 4.1% | 3.9% | 3.5% |
| Retirement | Target Percentage with 3% Maximum Adjustment | |||||
| Duration | Probability of Success | |||||
| (Years) | 70% | 75% | 80% | 85% | 90% | 95% |
| 10 | 12.4% | 12.1% | 11.8% | 11.5% | 11.1% | 10.5% |
| 15 | 9.4% | 9.1% | 8.9% | 8.6% | 8.2% | 7.7% |
| 20 | 7.9% | 7.7% | 7.5% | 7.2% | 6.8% | 6.3% |
| 25 | 7.1% | 6.9% | 6.6% | 6.4% | 6.0% | 5.6% |
| 30 | 6.5% | 6.3% | 6.1% | 5.8% | 5.5% | 5.1% |
| 35 | 6.1% | 5.9% | 5.7% | 5.5% | 5.2% | 4.7% |
| 40 | 5.8% | 5.6% | 5.4% | 5.2% | 4.9% | 4.5% |
| Retirement | Target Percentage Adjustment | |||||
| Duration | Probability of Success | |||||
| (Years) | 70% | 75% | 80% | 85% | 90% | 95% |
| 10 | 12.9% | 12.9% | 12.6% | 12.3% | 11.9% | 11.3% |
| 15 | 10.2% | 10.0% | 9.7% | 9.5% | 9.1% | 8.5% |
| 20 | 8.8% | 8.6% | 8.4% | 8.1% | 7.7% | 7.2% |
| 25 | 8.0% | 7.8% | 7.6% | 7.3% | 7.0% | 6.5% |
| 30 | 7.5% | 7.3% | 7.1% | 6.8% | 6.5% | 6.0% |
| 35 | 7.1% | 6.9% | 6.7% | 6.4% | 6.1% | 5.7% |
| 40 | 6.8% | 6.6% | 6.4% | 6.1% | 5.8% | 5.4% |
| Table C 50% Stocks / 50% Bonds |
||||||
| 40% Large cap / 10% Small cap / 50% ITGB | ||||||
| Highest Initial Withdrawal Rate | ||||||
| Retirement | Traditional Safe Withdrawal Rates | |||||
| Duration | Probability of Success | |||||
| (Years) | 70% | 75% | 80% | 85% | 90% | 95% |
| 10 | 11.5% | 11.2% | 10.8% | 10.5% | 10.0% | 9.3% |
| 15 | 8.4% | 8.2% | 7.9% | 7.5% | 7.1% | 6.5% |
| 20 | 7.0% | 6.7% | 6.4% | 6.1% | 5.7% | 5.2% |
| 25 | 6.1% | 5.9% | 5.6% | 5.3% | 5.0% | 4.5% |
| 30 | 5.6% | 5.4% | 5.1% | 4.8% | 4.5% | 4.0% |
| 35 | 5.2% | 5.0% | 4.8% | 4.5% | 4.1% | 3.7% |
| 40 | 5.0% | 4.8% | 4.5% | 4.2% | 3.9% | 3.4% |
| Retirement | Target Percentage With 3% Maximum Adjustment | |||||
| Duration | Probability of Success | |||||
| (Years) | 70% | 75% | 80% | 85% | 90% | 95% |
| 10 | 12.4% | 12.1% | 11.8% | 11.4% | 10.9% | 10.2% |
| 15 | 9.5% | 9.2% | 8.9% | 8.5% | 8.1% | 7.5% |
| 20 | 8.0% | 7.8% | 7.5% | 7.1% | 6.8% | 6.2% |
| 25 | 7.2% | 6.9% | 6.7% | 6.4% | 6.0% | 5.5% |
| 30 | 6.7% | 6.4% | 6.2% | 5.9% | 5.5% | 5.0% |
| 35 | 6.3% | 6.0% | 5.8% | 5.5% | 5.1% | 4.7% |
| 40 | 6.0% | 5.8% | 5.5% | 5.2% | 4.9% | 4.4% |
| Retirement | Target Percentage Adjustment | |||||
| Duration | Probability of Success | |||||
| (Years) | 70% | 75% | 80% | 85% | 90% | 95% |
| 10 | 12.9% | 12.9% | 12.5% | 12.2% | 11.7% | 11.0% |
| 15 | 10.3% | 10.0% | 9.7% | 9.4% | 8.9% | 8.3% |
| 20 | 8.9% | 8.7% | 8.4% | 8.0% | 7.6% | 7.0% |
| 25 | 8.1% | 7.9% | 7.6% | 7.3% | 6.9% | 6.3% |
| 30 | 7.6% | 7.3% | 7.1% | 6.8% | 6.4% | 5.9% |
| 35 | 7.2% | 7.0% | 6.7% | 6.4% | 6.1% | 5.6% |
| 40 | 6.9% | 6.7% | 6.4% | 6.1% | 5.8% | 5.3% |
| Table D 60% Stocks / 40% Bonds |
||||||
| 48% Large cap / 12% Small cap / 40% ITGB | ||||||
| Highest Initial Withdrawal Rate | ||||||
| Retirement | Traditional Safe Withdrawal Rates | |||||
| Duration | Probability of Success | |||||
| (Years) | 70% | 75% | 80% | 85% | 90% | 95% |
| 10 | 11.5% | 11.2% | 10.8% | 10.3% | 9.8% | 9.0% |
| 15 | 8.5% | 8.2% | 7.9% | 7.5% | 7.0% | 6.3% |
| 20 | 7.1% | 6.8% | 6.5% | 6.1% | 5.6% | 5.0% |
| 25 | 6.3% | 6.0% | 5.7% | 5.3% | 4.9% | 4.3% |
| 30 | 5.8% | 5.5% | 5.2% | 4.8% | 4.4% | 3.9% |
| 35 | 5.4% | 5.1% | 4.8% | 4.5% | 4.1% | 3.6% |
| 40 | 5.2% | 4.9% | 4.6% | 4.3% | 3.9% | 3.3% |
| Retirement | Target Percentage with 3% Maximum Adjustment | |||||
| Duration | Probability of Success | |||||
| (Years) | 70% | 75% | 80% | 85% | 90% | 95% |
| 10 | 12.5% | 12.1% | 11.7% | 11.3% | 10.7% | 9.9% |
| 15 | 9.5% | 9.2% | 8.8% | 8.4% | 7.9% | 7.2% |
| 20 | 8.1% | 7.8% | 7.5% | 7.1% | 6.6% | 5.9% |
| 25 | 7.3% | 7.0% | 6.7% | 6.3% | 5.9% | 5.2% |
| 30 | 6.8% | 6.5% | 6.2% | 5.8% | 5.4% | 4.8% |
| 35 | 6.4% | 6.1% | 5.8% | 5.5% | 5.1% | 4.5% |
| 40 | 6.1% | 5.9% | 5.6% | 5.2% | 4.8% | 4.2% |
| Retirement | Target Percentage Adjustment | |||||
| Duration | Probability of Success | |||||
| (Years) | 70% | 75% | 80% | 85% | 90% | 95% |
| 10 | 12.9% | 12.8% | 12.5% | 12.0% | 11.4% | 10.6% |
| 15 | 10.3% | 10.0% | 9.7% | 9.2% | 8.7% | 8.0% |
| 20 | 9.0% | 8.7% | 8.3% | 7.9% | 7.4% | 6.7% |
| 25 | 8.2% | 7.9% | 7.6% | 7.2% | 6.7% | 6.1% |
| 30 | 7.7% | 7.4% | 7.1% | 6.7% | 6.2% | 5.6% |
| 35 | 7.3% | 7.0% | 6.7% | 6.4% | 5.9% | 5.3% |
| 40 | 7.0% | 6.7% | 6.4% | 6.1% | 5.6% | 5.1% |
| Table E 70% Stocks / 30% Bonds |
||||||
| 56% Large cap / 14% Small cap / 30% ITGB | ||||||
| Highest Initial Withdrawal Rate | ||||||
| Retirement | Traditional Safe Withdrawal Rates | |||||
| Duration | Probability of Success | |||||
| (Years) | 70% | 75% | 80% | 85% | 90% | 95% |
| 10 | 11.6% | 11.1% | 10.7% | 10.2% | 9.5% | 8.6% |
| 15 | 8.6% | 8.2% | 7.8% | 7.4% | 6.8% | 6.0% |
| 20 | 7.2% | 6.8% | 6.4% | 6.0% | 5.5% | 4.8% |
| 25 | 6.3% | 6.0% | 5.7% | 5.3% | 4.8% | 4.1% |
| 30 | 5.9% | 5.5% | 5.2% | 4.8% | 4.3% | 3.7% |
| 35 | 5.5% | 5.2% | 4.8% | 4.5% | 4.0% | 3.4% |
| 40 | 5.3% | 5.0% | 4.6% | 4.3% | 3.8% | 3.2% |
| Retirement | Target Percentage with 3% Maximum Adjustment | |||||
| Duration | Probability of Success | |||||
| (Years) | 70% | 75% | 80% | 85% | 90% | 95% |
| 10 | 12.5% | 12.0% | 11.6% | 11.1% | 10.4% | 9.5% |
| 15 | 9.5% | 9.2% | 8.8% | 8.3% | 7.7% | 6.9% |
| 20 | 8.1% | 7.8% | 7.4% | 7.0% | 6.4% | 5.7% |
| 25 | 7.3% | 7.0% | 6.6% | 6.2% | 5.7% | 5.0% |
| 30 | 6.8% | 6.5% | 6.1% | 5.7% | 5.2% | 4.6% |
| 35 | 6.5% | 6.2% | 5.8% | 5.4% | 4.9% | 4.3% |
| 40 | 6.2% | 5.9% | 5.6% | 5.2% | 4.7% | 4.1% |
| Retirement | Target Percentage Adjustment | |||||
| Duration | Probability of Success | |||||
| (Years) | 70% | 75% | 80% | 85% | 90% | 95% |
| 10 | 12.9% | 12.8% | 12.3% | 11.8% | 11.1% | 10.2% |
| 15 | 10.3% | 10.0% | 9.5% | 9.1% | 8.5% | 7.6% |
| 20 | 9.0% | 8.6% | 8.2% | 7.8% | 7.2% | 6.4% |
| 25 | 8.2% | 7.9% | 7.5% | 7.0% | 6.5% | 5.8% |
| 30 | 7.7% | 7.3% | 7.0% | 6.6% | 6.0% | 5.3% |
| 35 | 7.3% | 7.0% | 6.6% | 6.2% | 5.7% | 5.0% |
| 40 | 7.0% | 6.7% | 6.4% | 5.9% | 5.5% | 4.8% |